Dashboard
We are experiencing the consequences of a warming world and the increase in the intensity and frequency of extreme weather events. Using the data extracted from NOAA website, we can see how the numbers of weather events have increased in the United States.
On this project we focused on the numbers of extreme weather events occurring from 1996 to 2020 in the US to see if there are any correlations with climate change. We have categorized the weather events into tornadoes, hurricanes, wind, thunderstorms, floods, cold and heat.
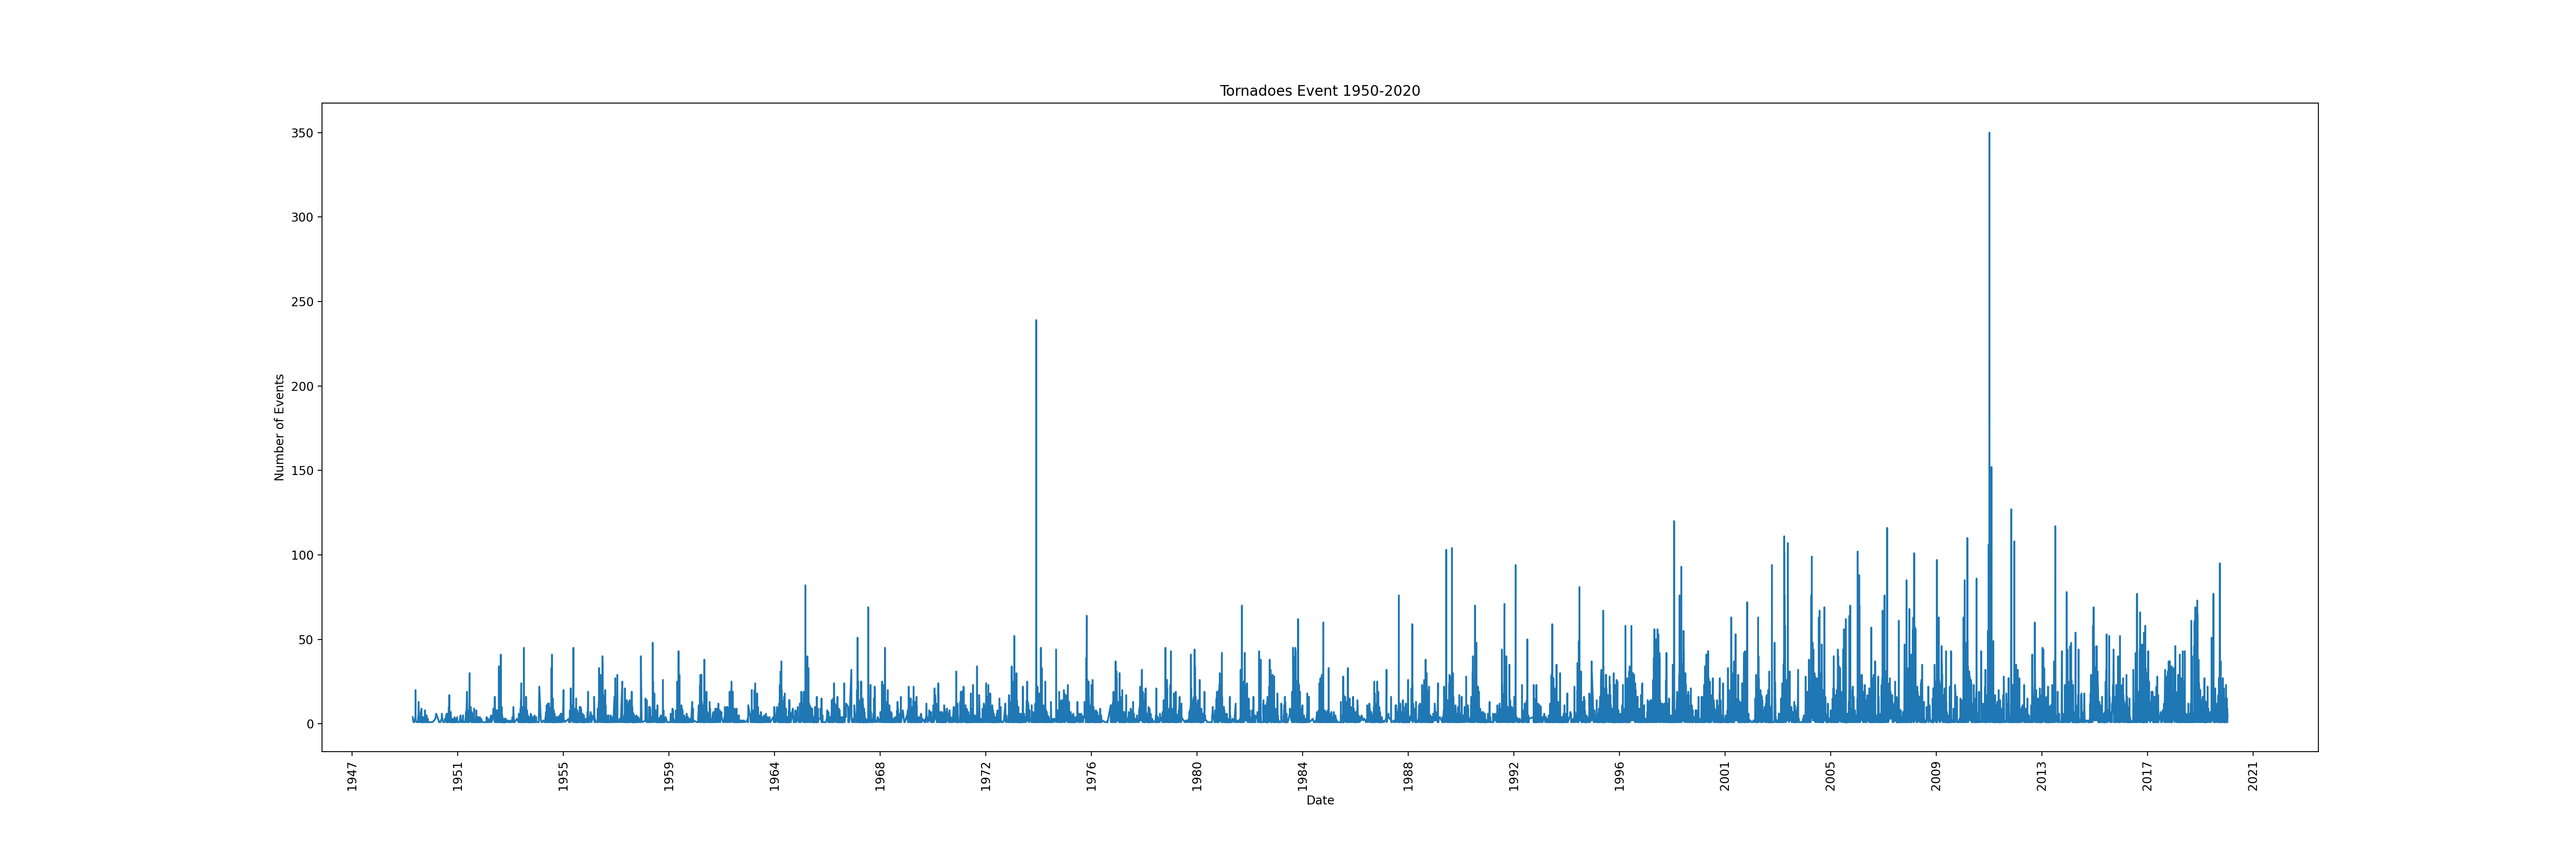
In the tornadoes graph, we do not see a big change throughout the years. It is possible that climate change has minimum influence on this type of weather event.
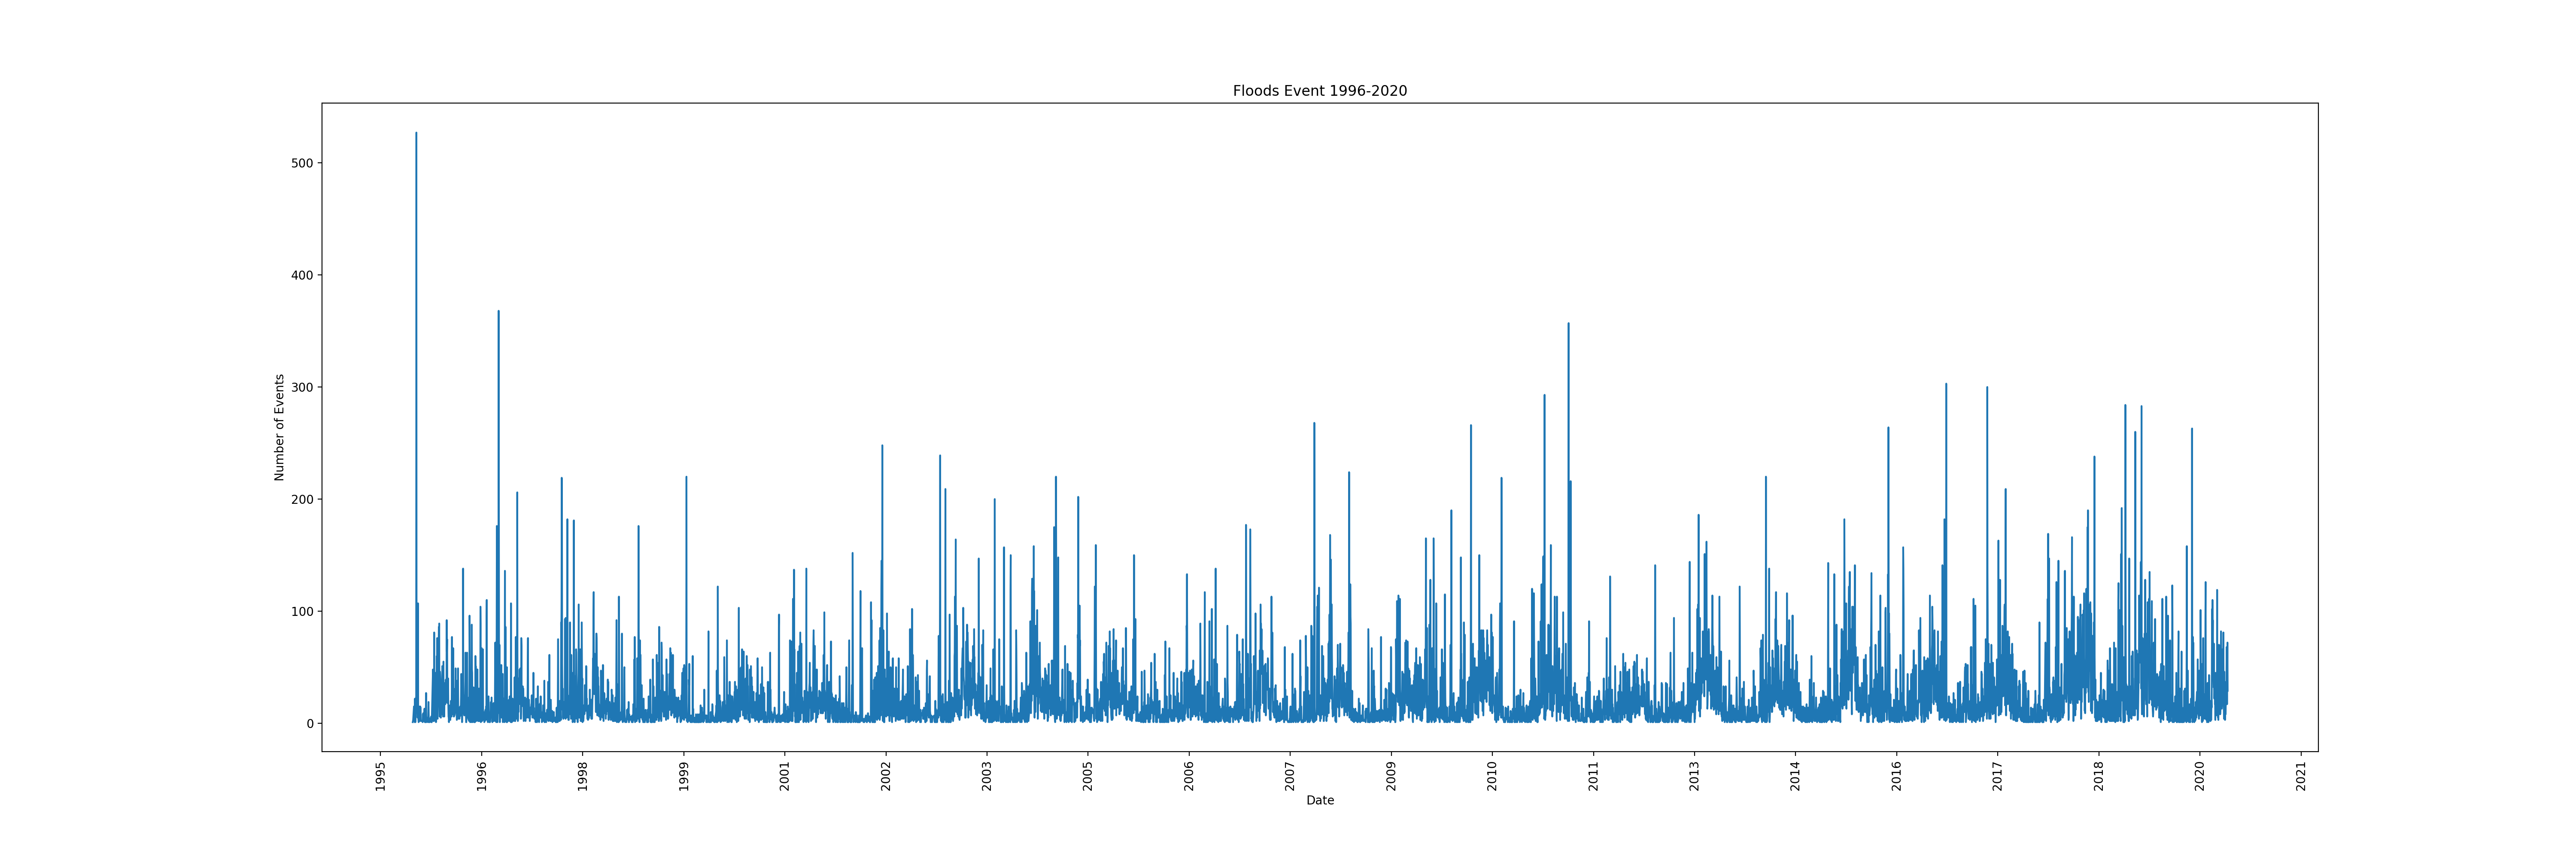
In the floods graph, we can observe a lot of frequency in most recent years. This weather event is more likely to be influenced by climate change.
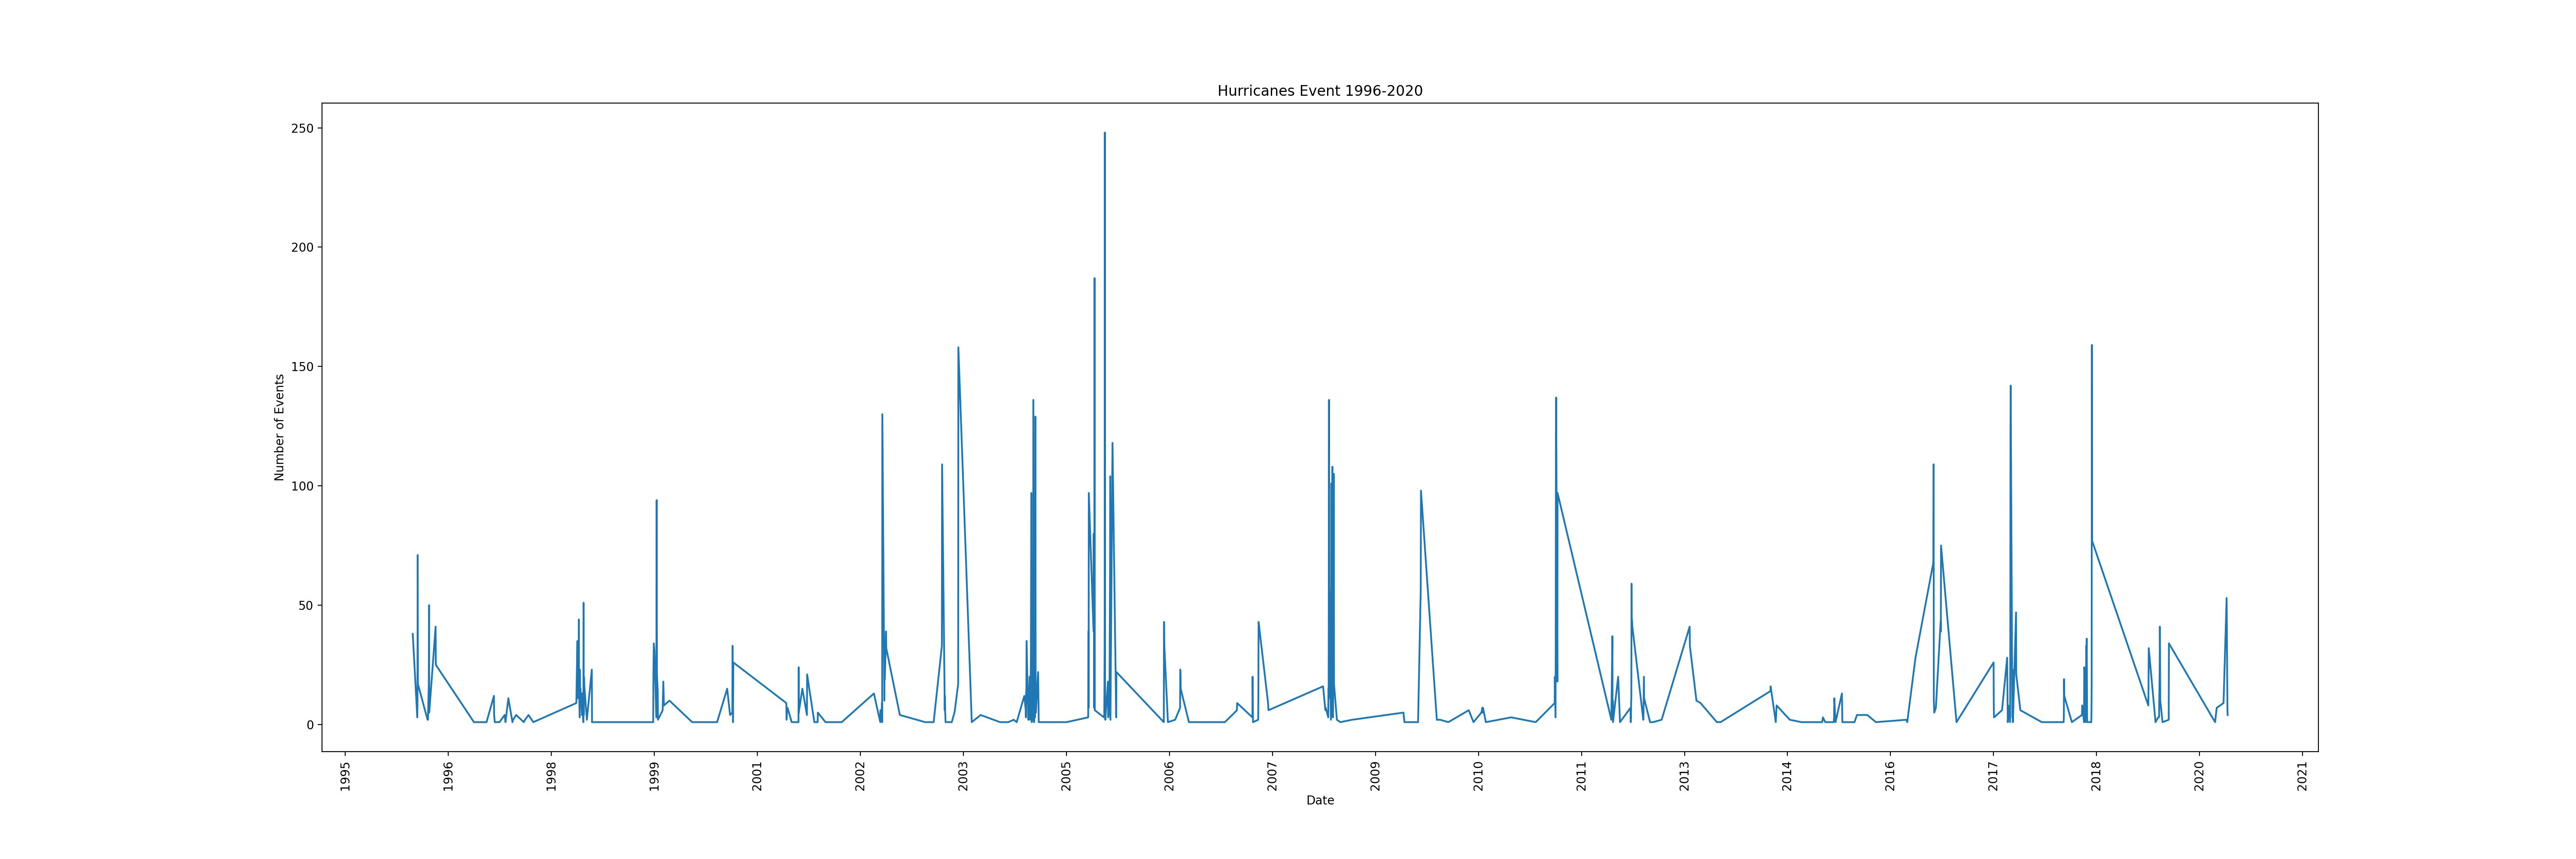
In the hurricane graph, we can observe that there is a pattern. It looks like there is a period of two years with less hurricane frequency before it increases. Recently we are not seeing that pattern. This weather event is highly likely to be influenced by climate change.
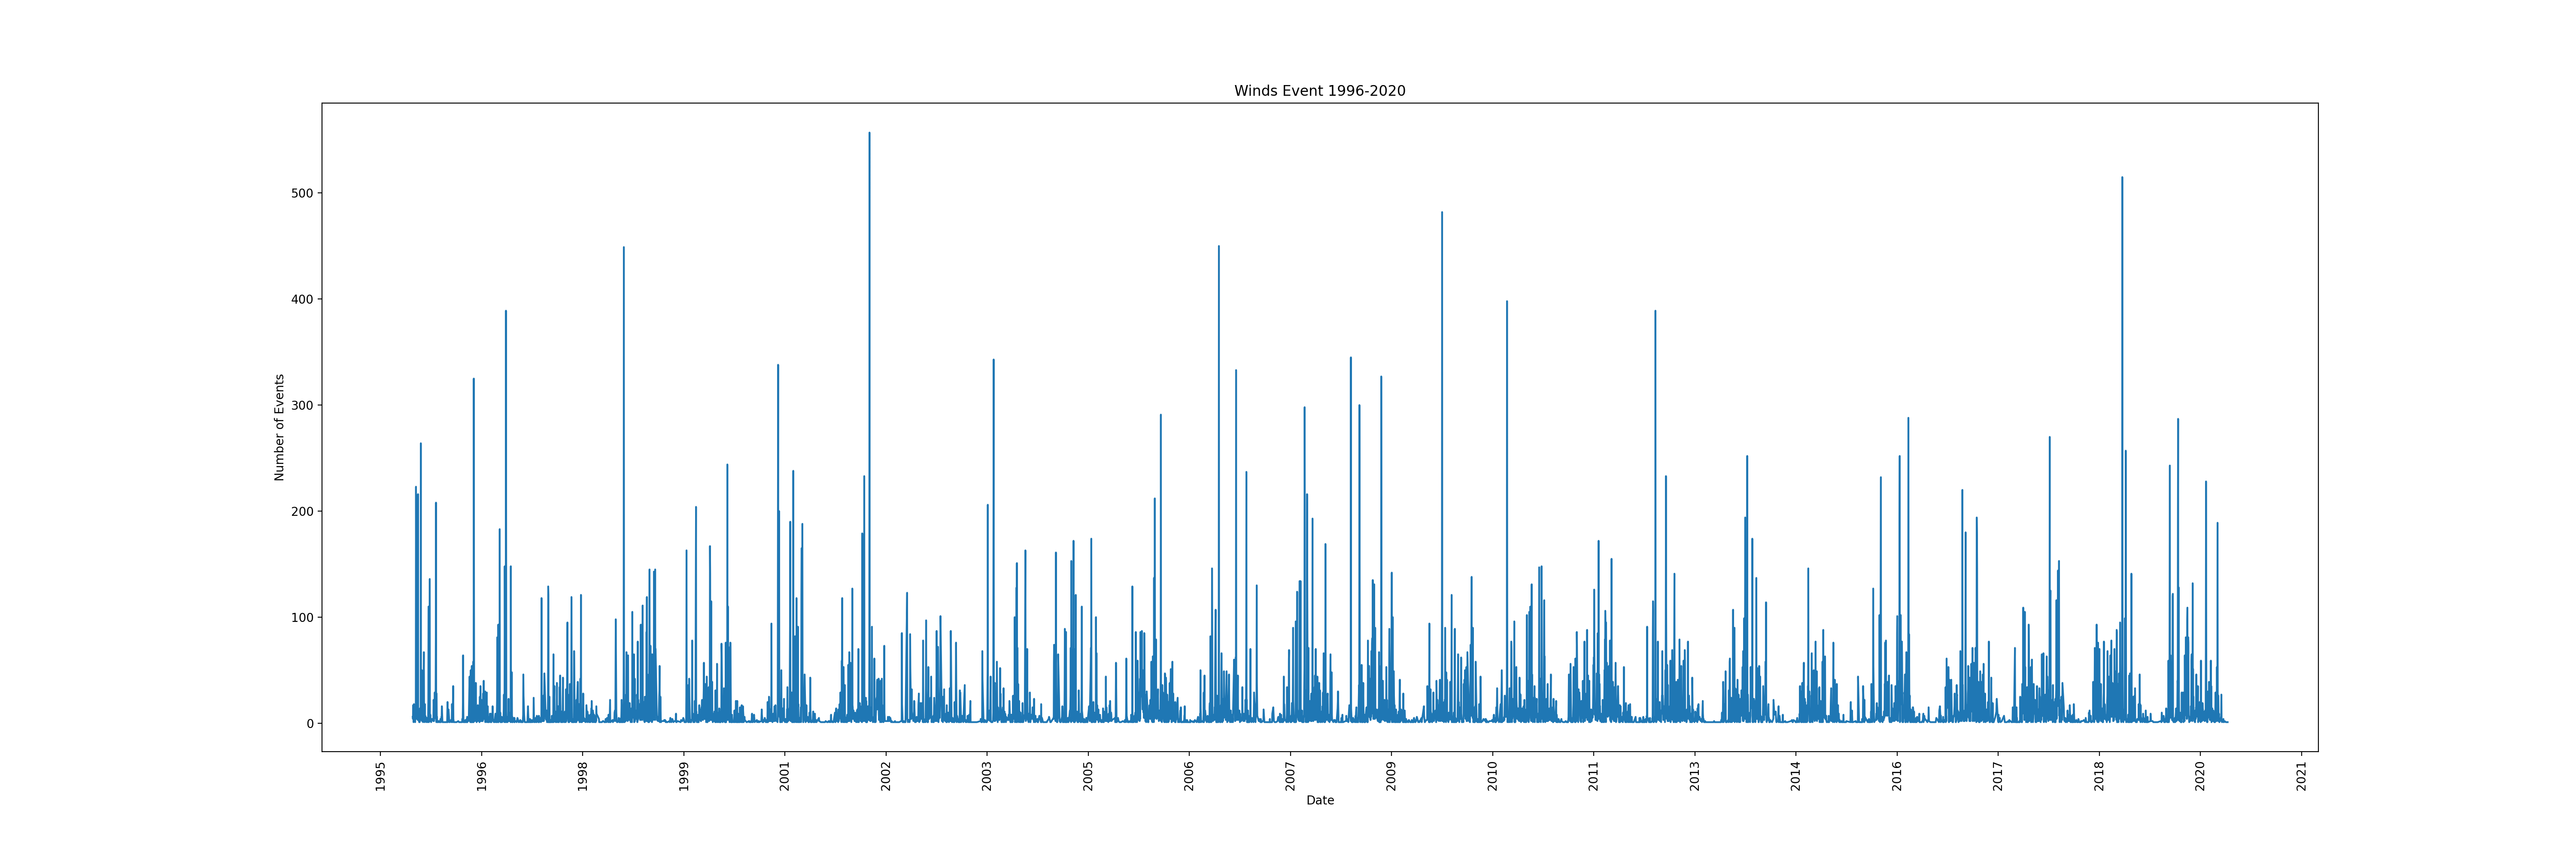
In the winds graph, we can observe a small increase in frequency. It is possible that climate change has little influence on this weather event.
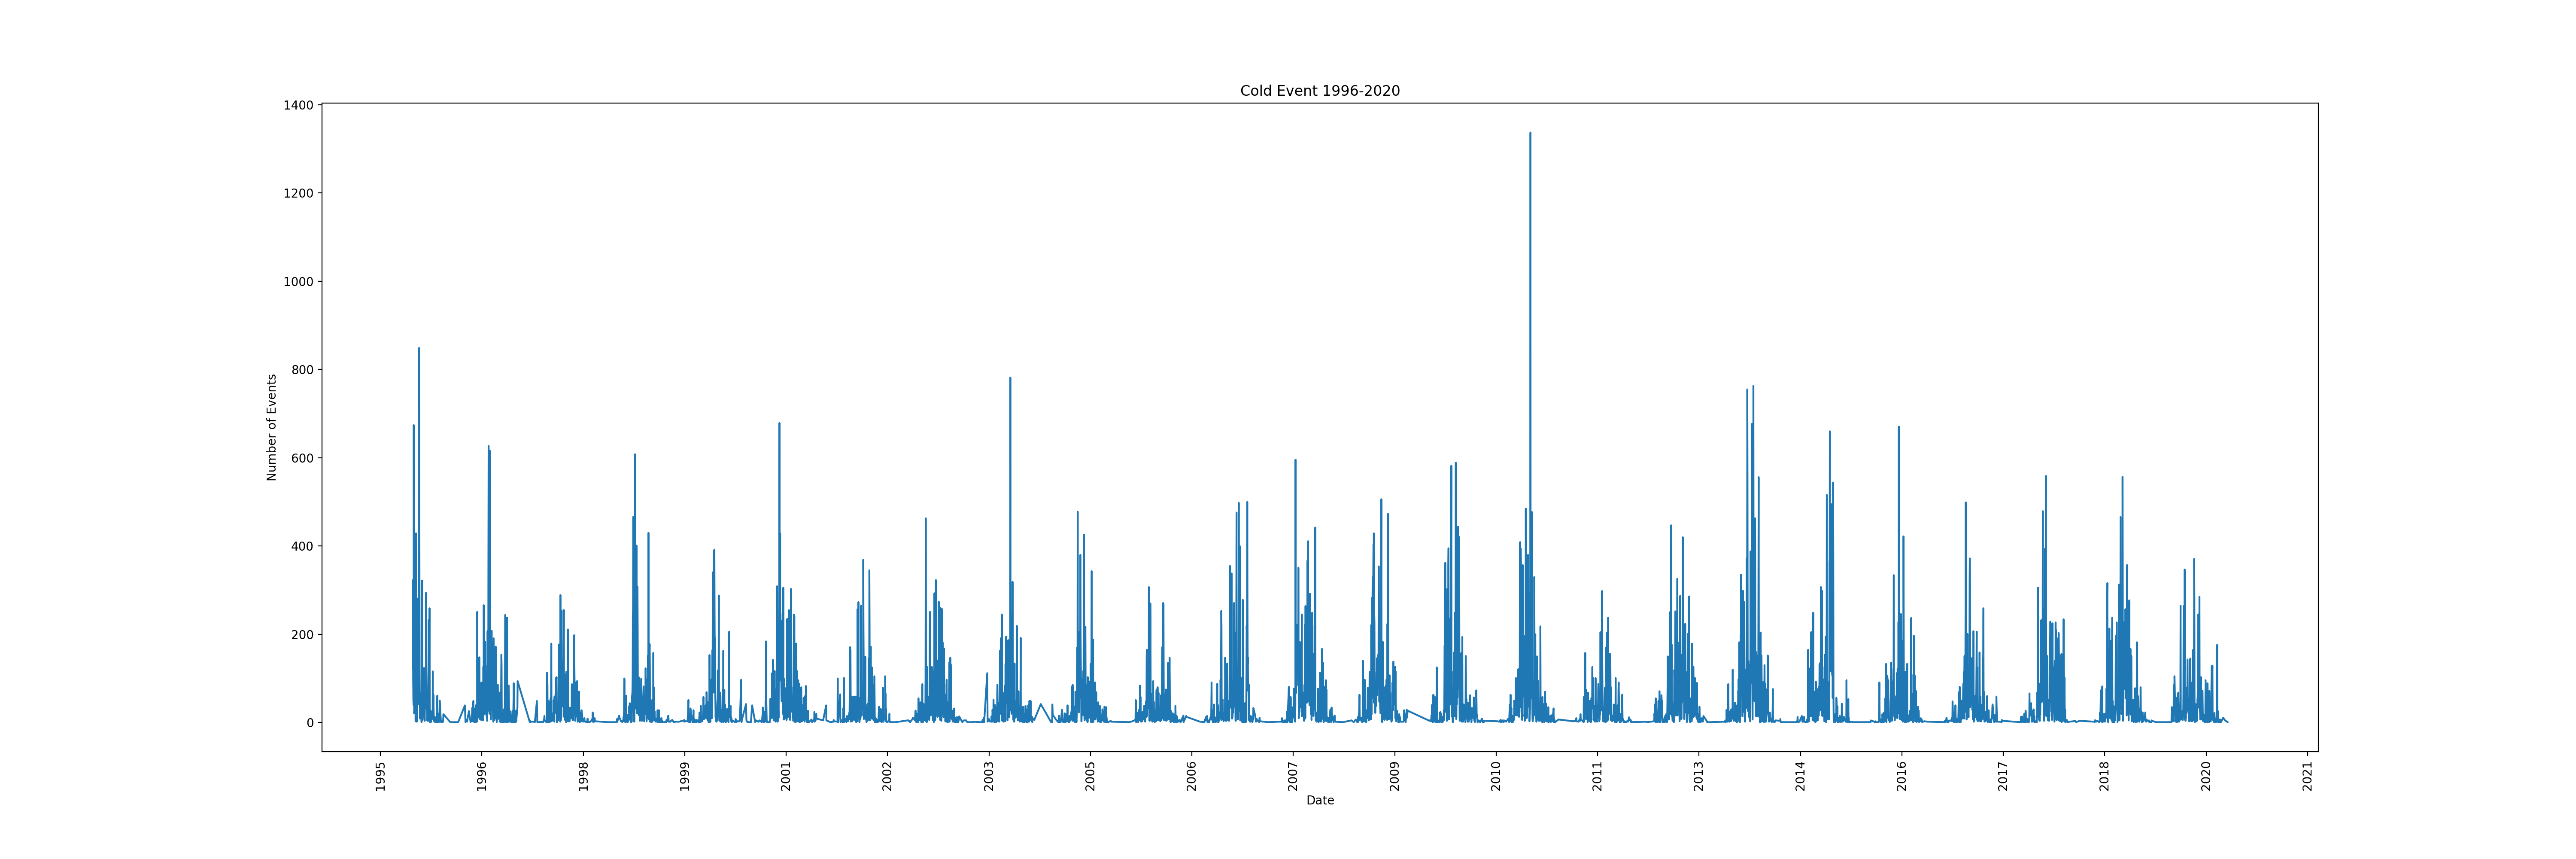
In the cold graph, we can observe a consistent increase and, in more recent years, we see an increase in frequency. It is likely that climate change has an influence on this weather event.
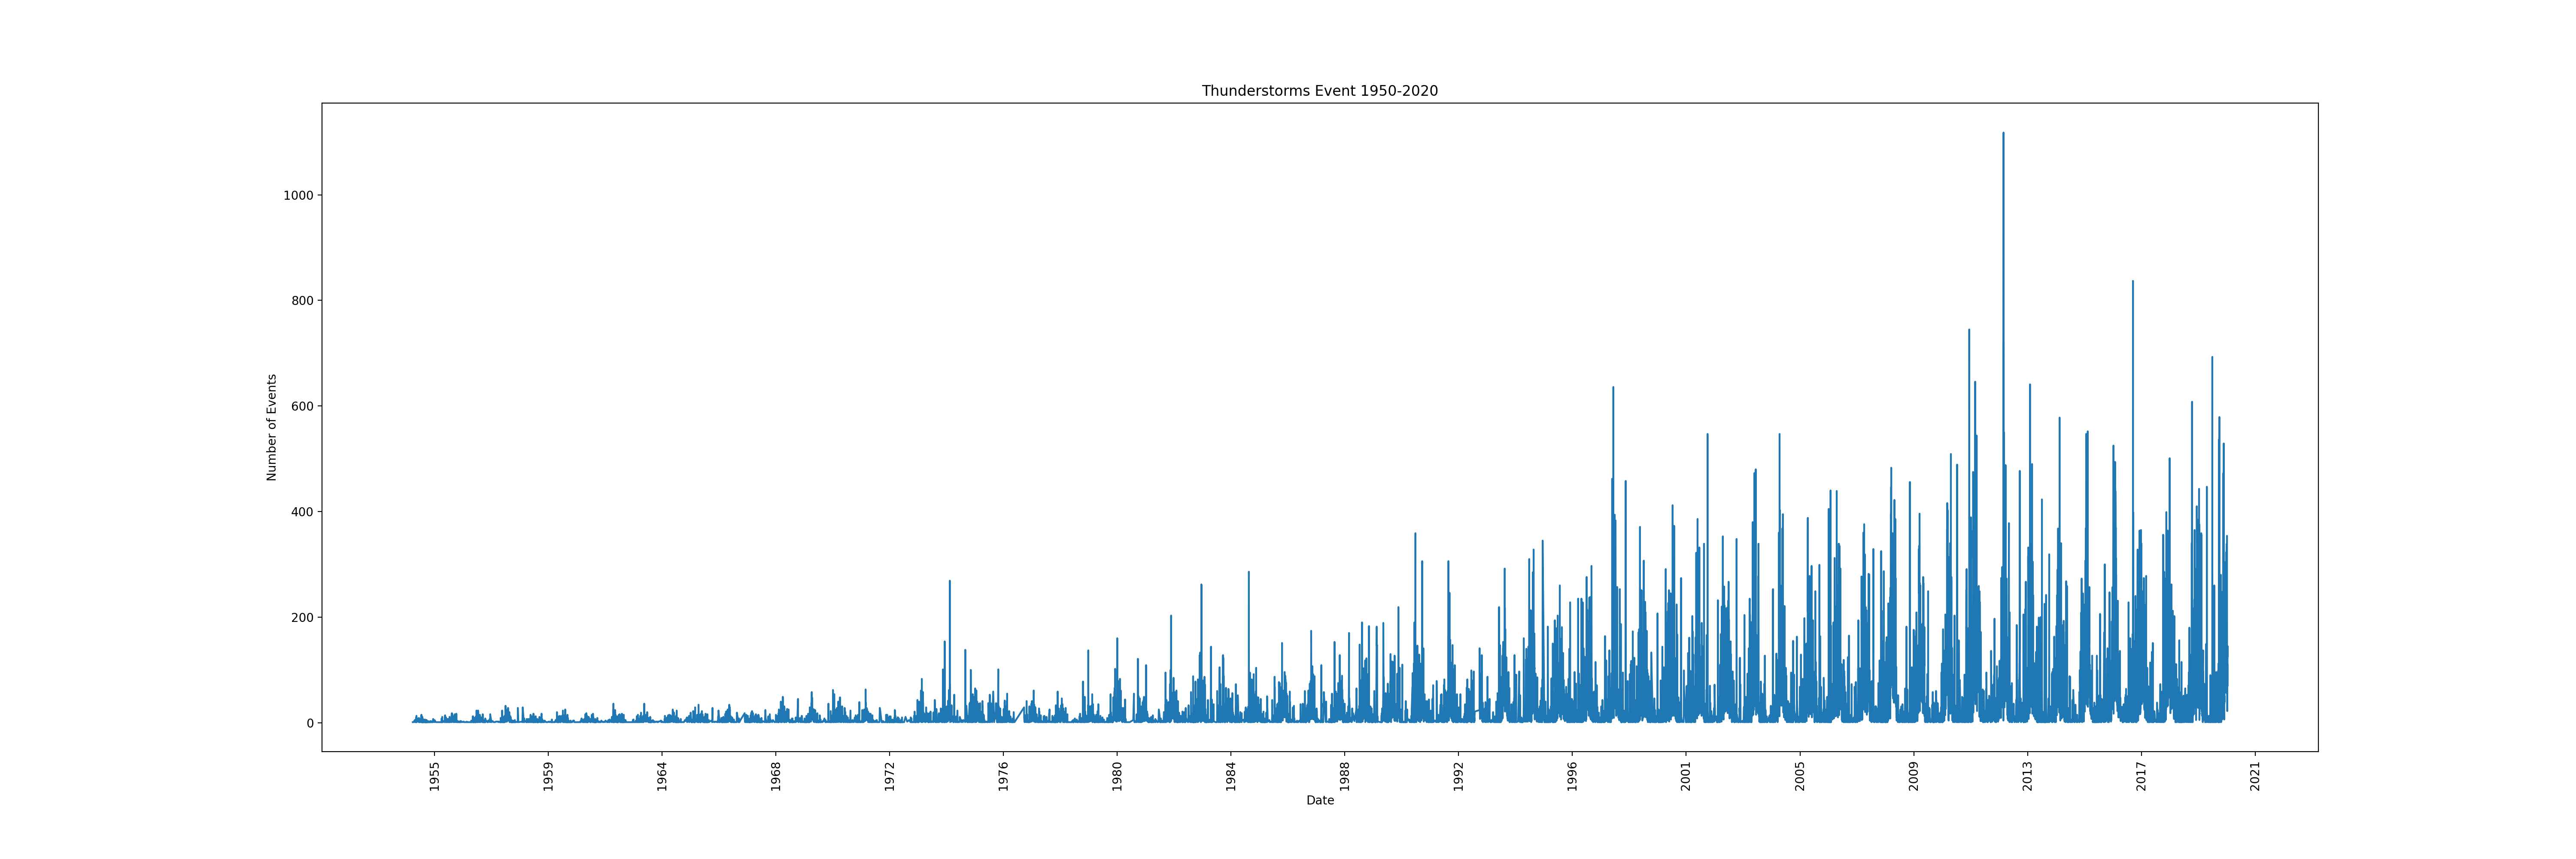
In the thunderstorms graph, we can observe a definite increase in frequency. Climate change seems to have a high influence on this weather event.
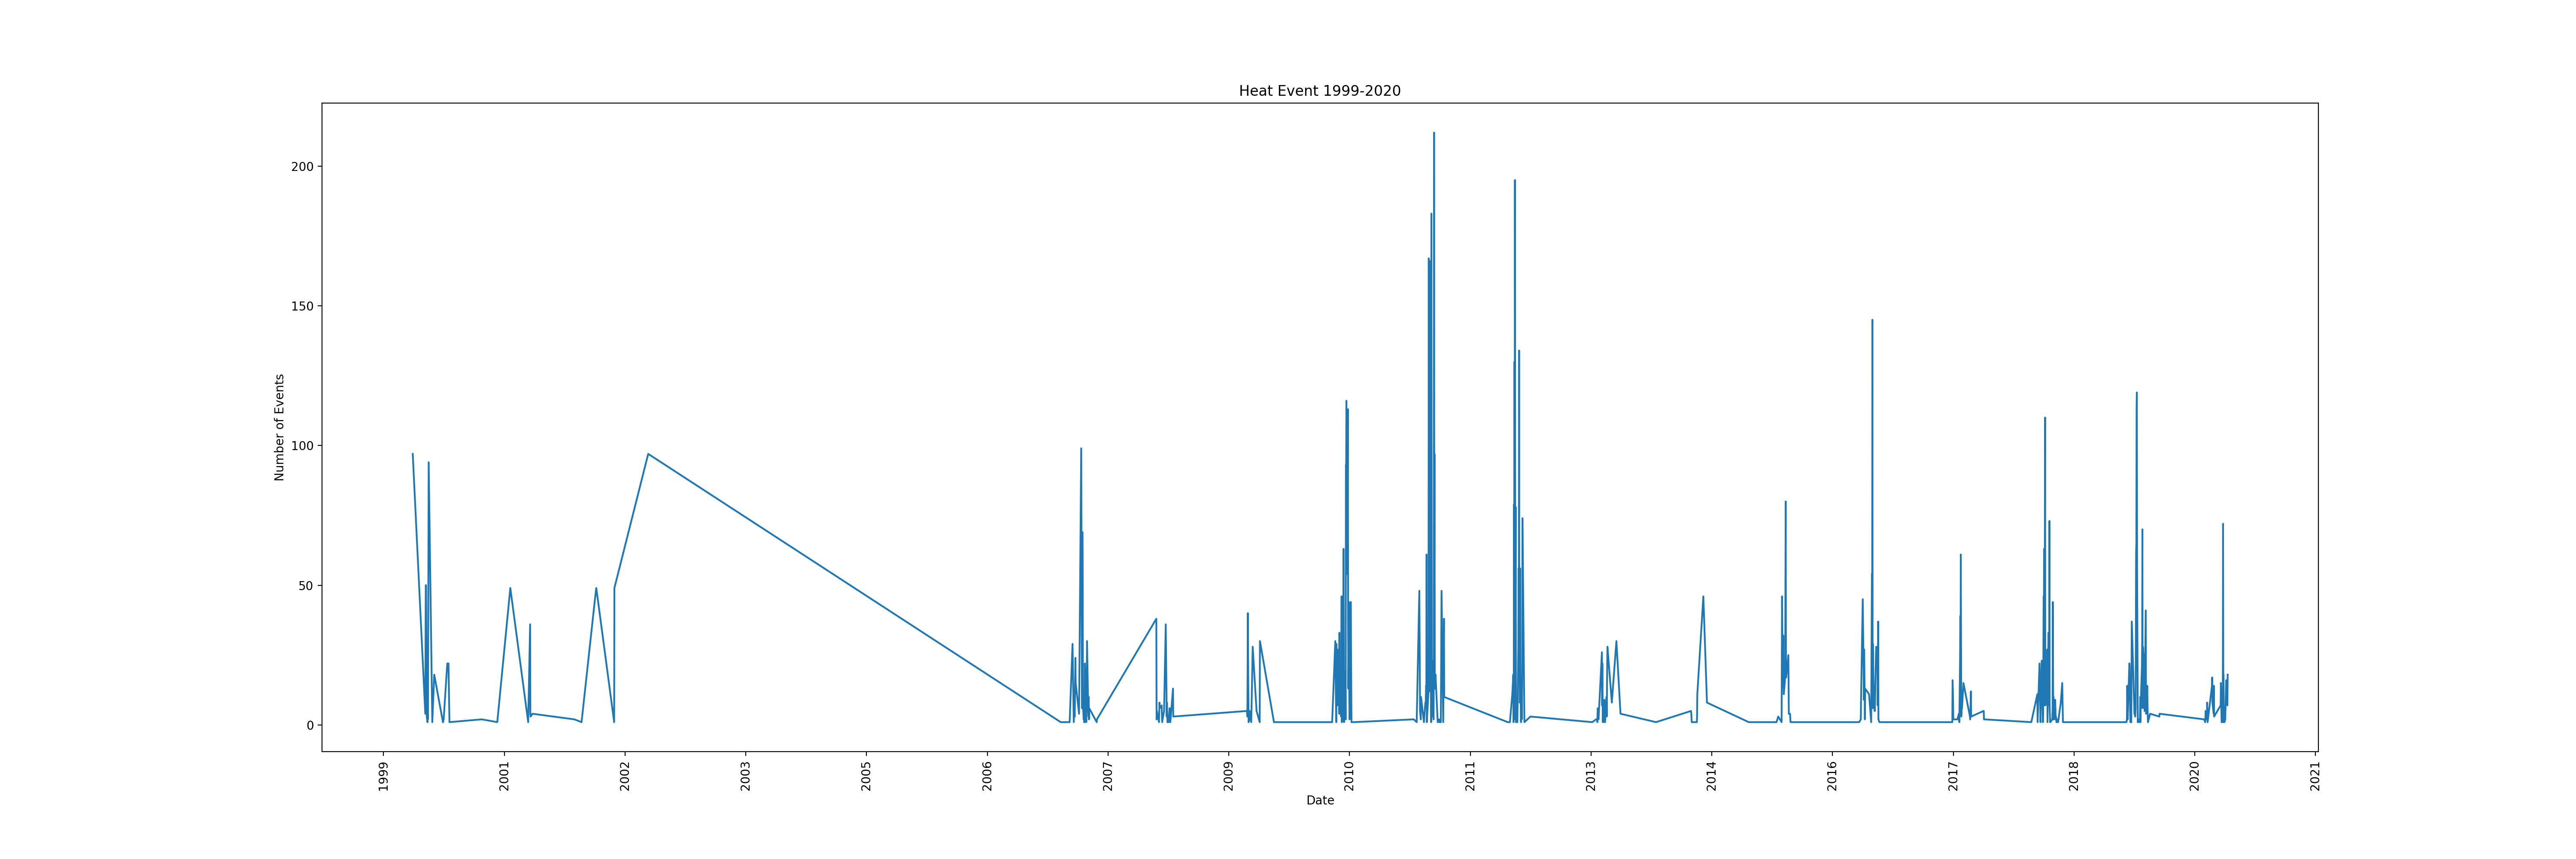
In the heat graph, we can see an increase in this weather type. Climate change could have an influence in this weather event.
Individual Storm Charts