Dashboard

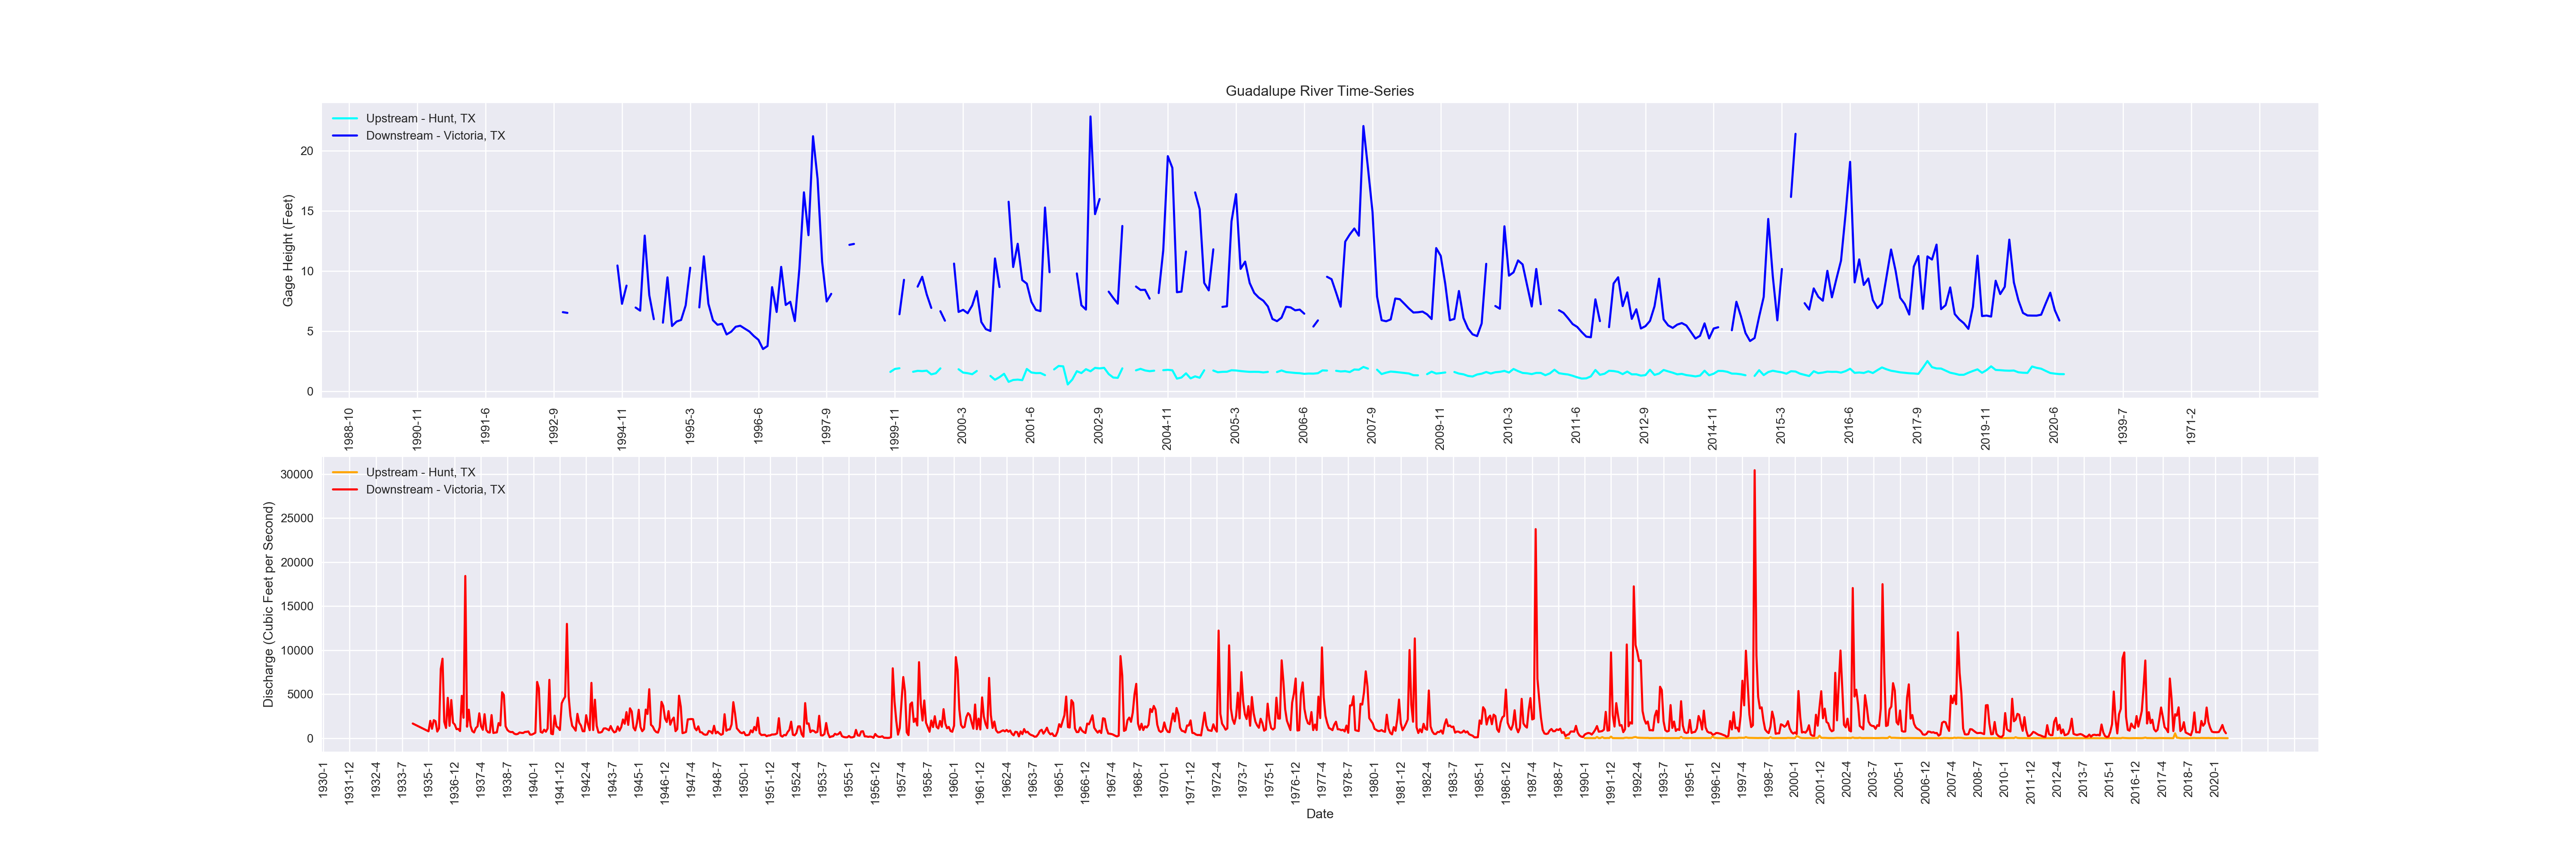
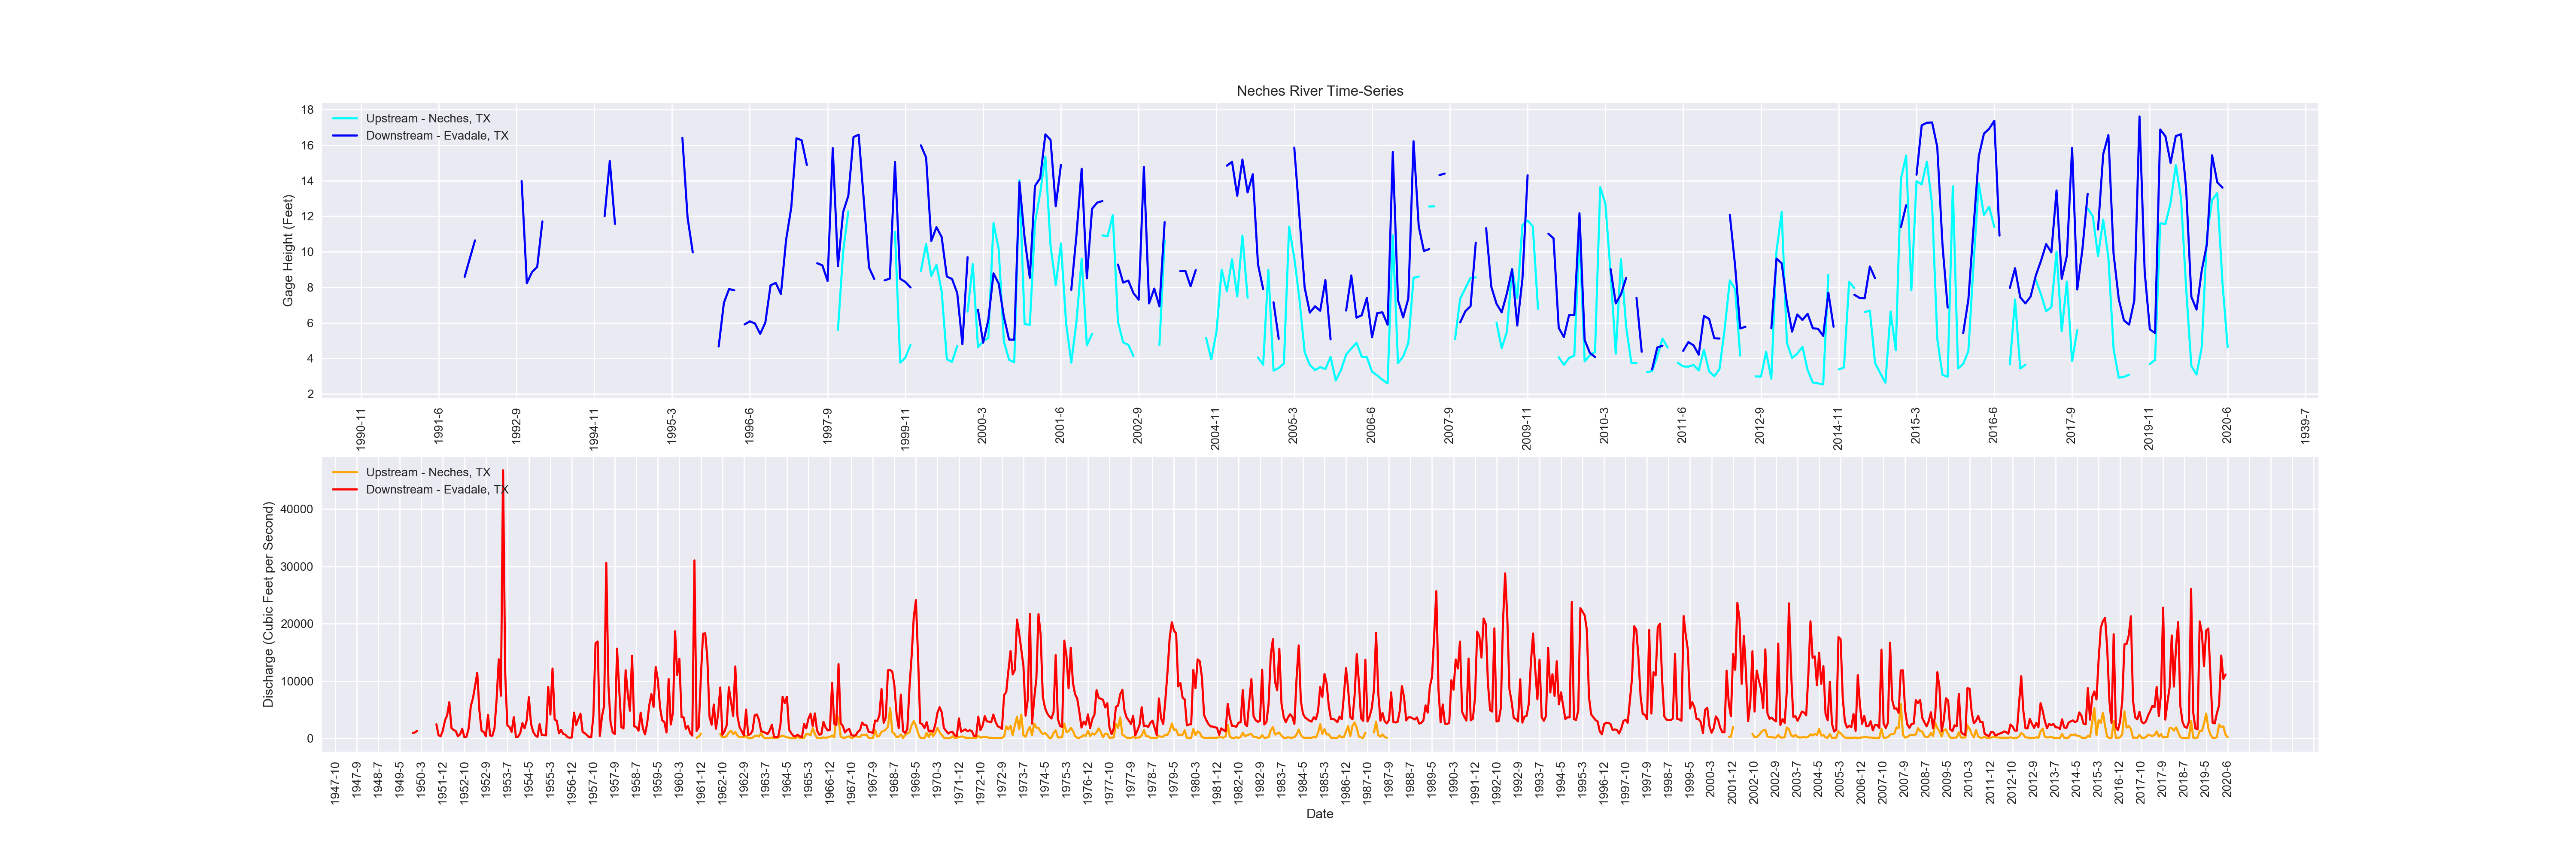
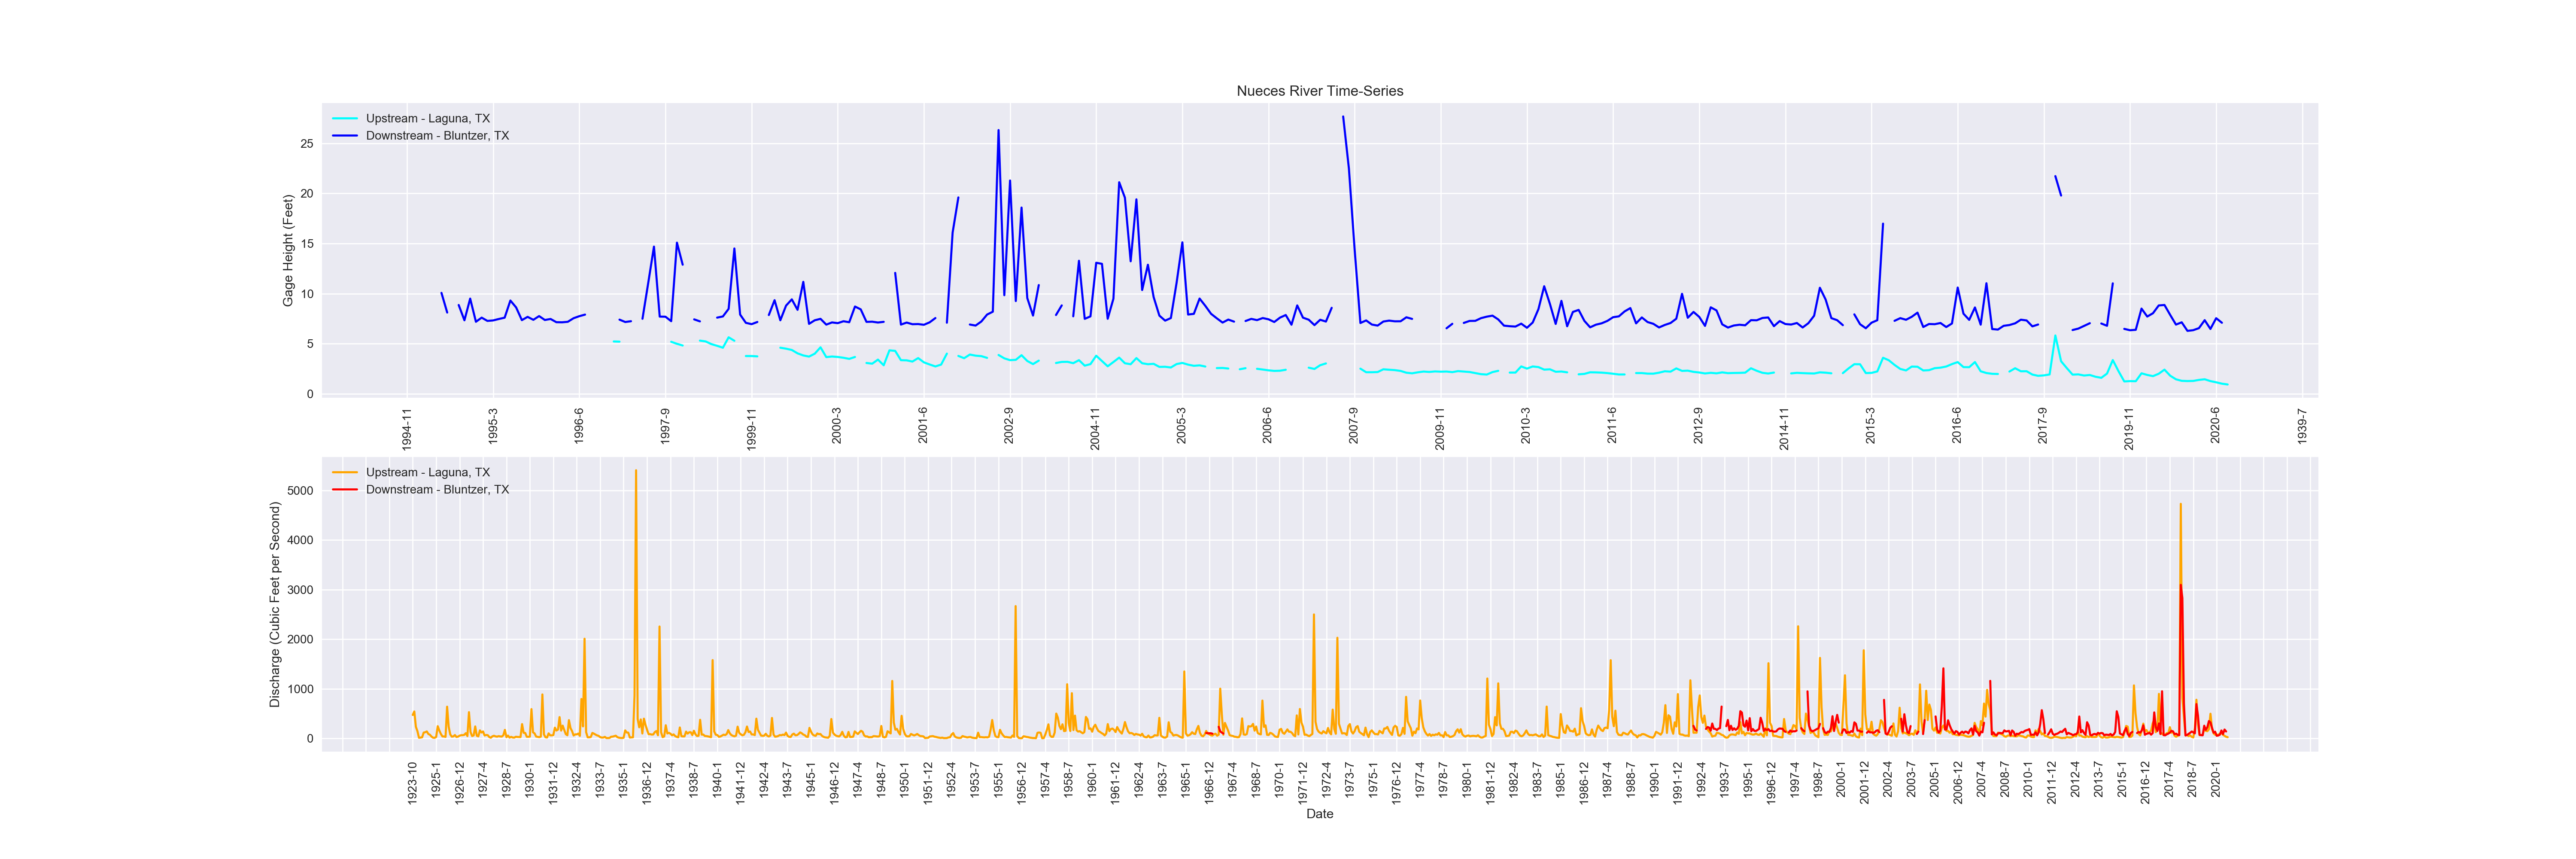
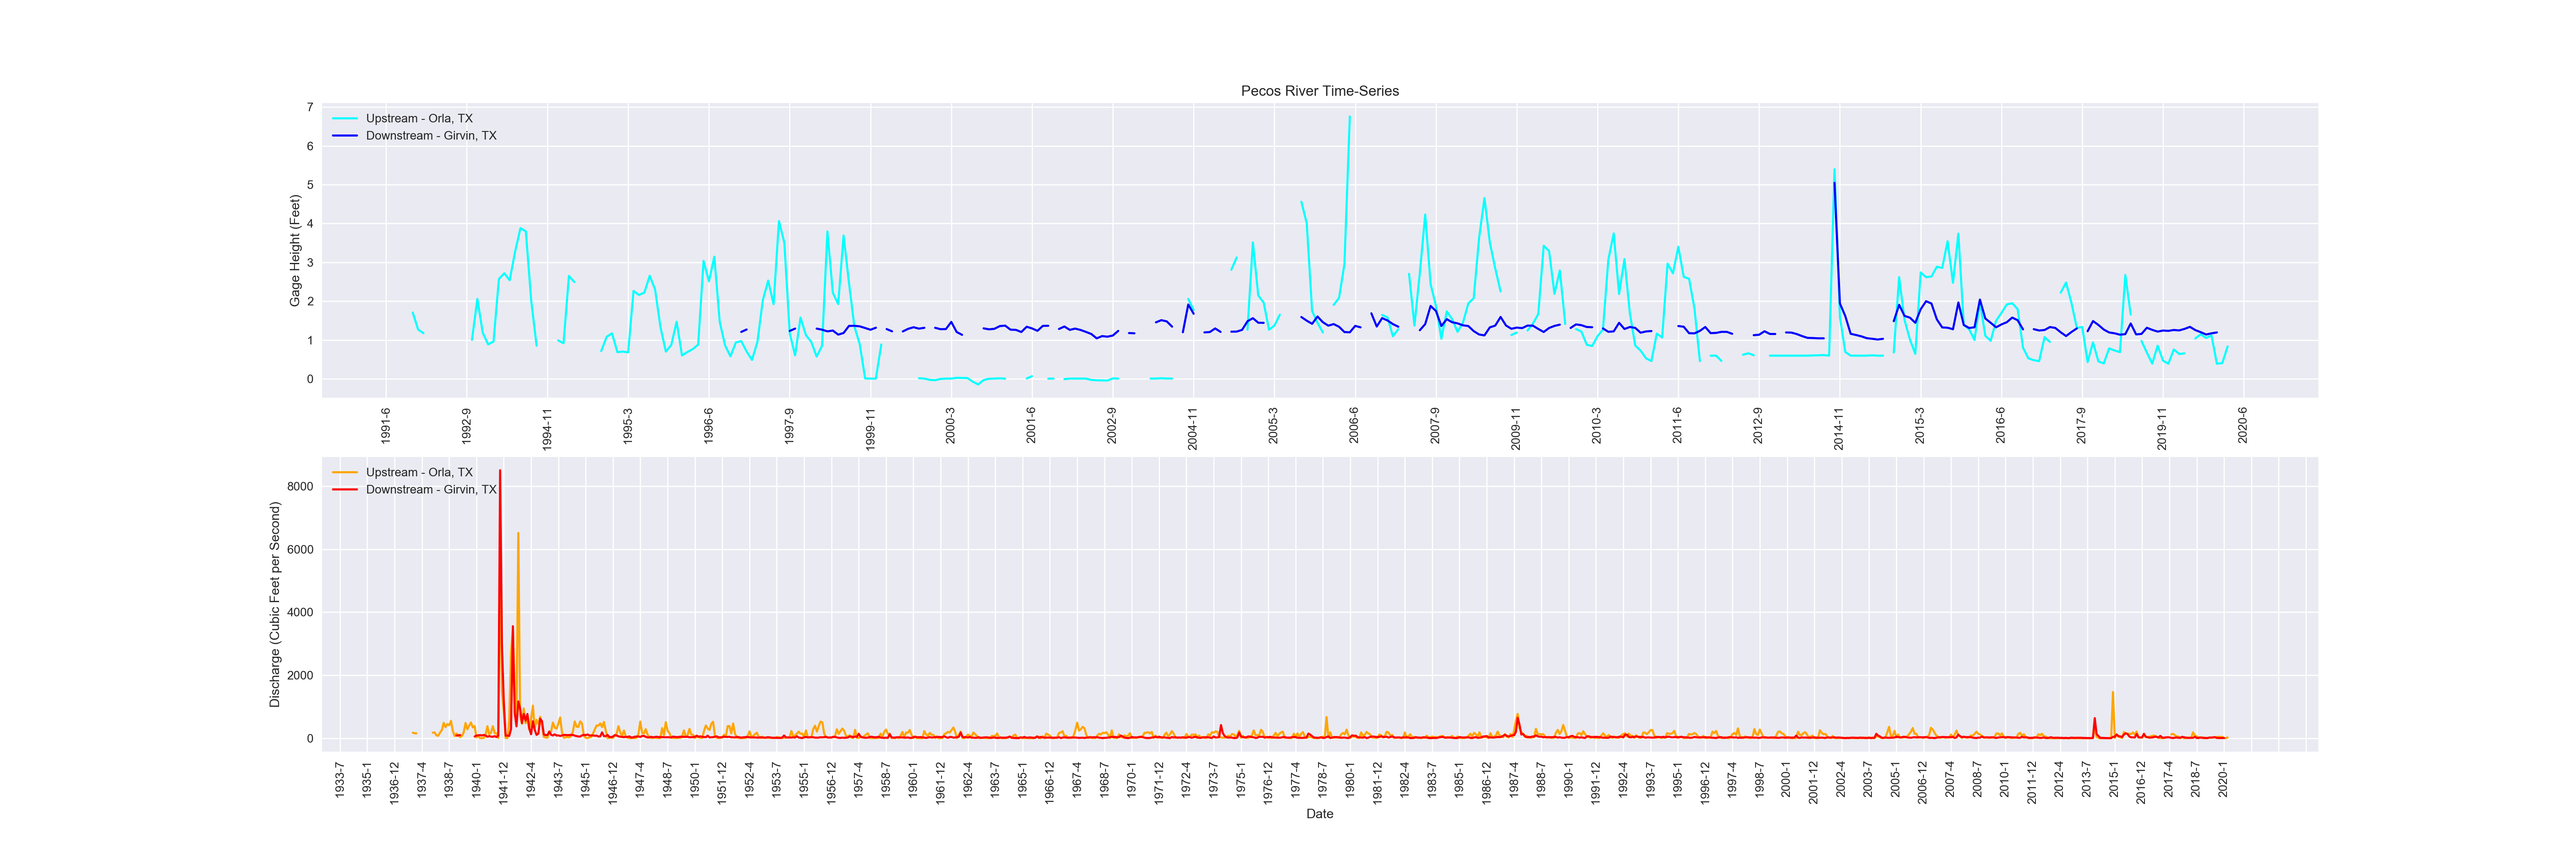
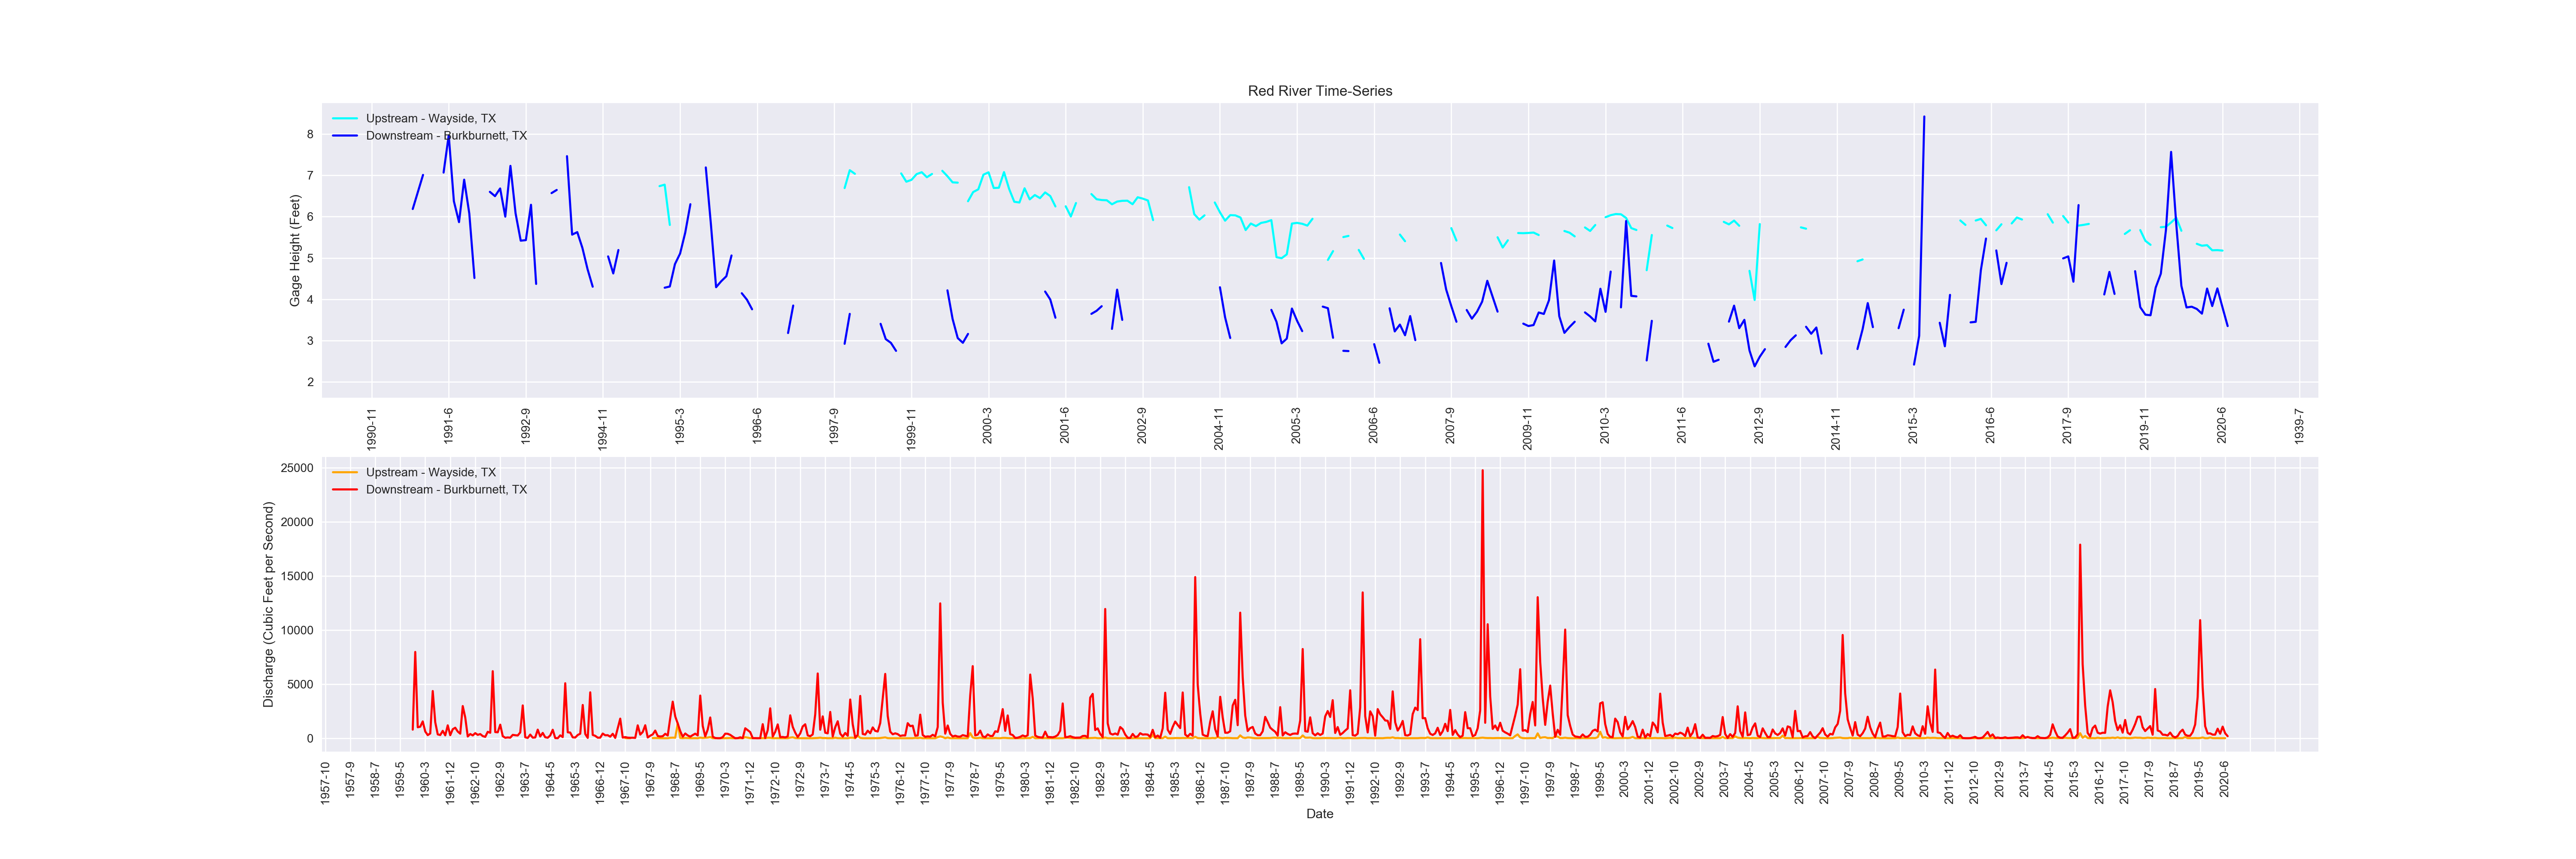
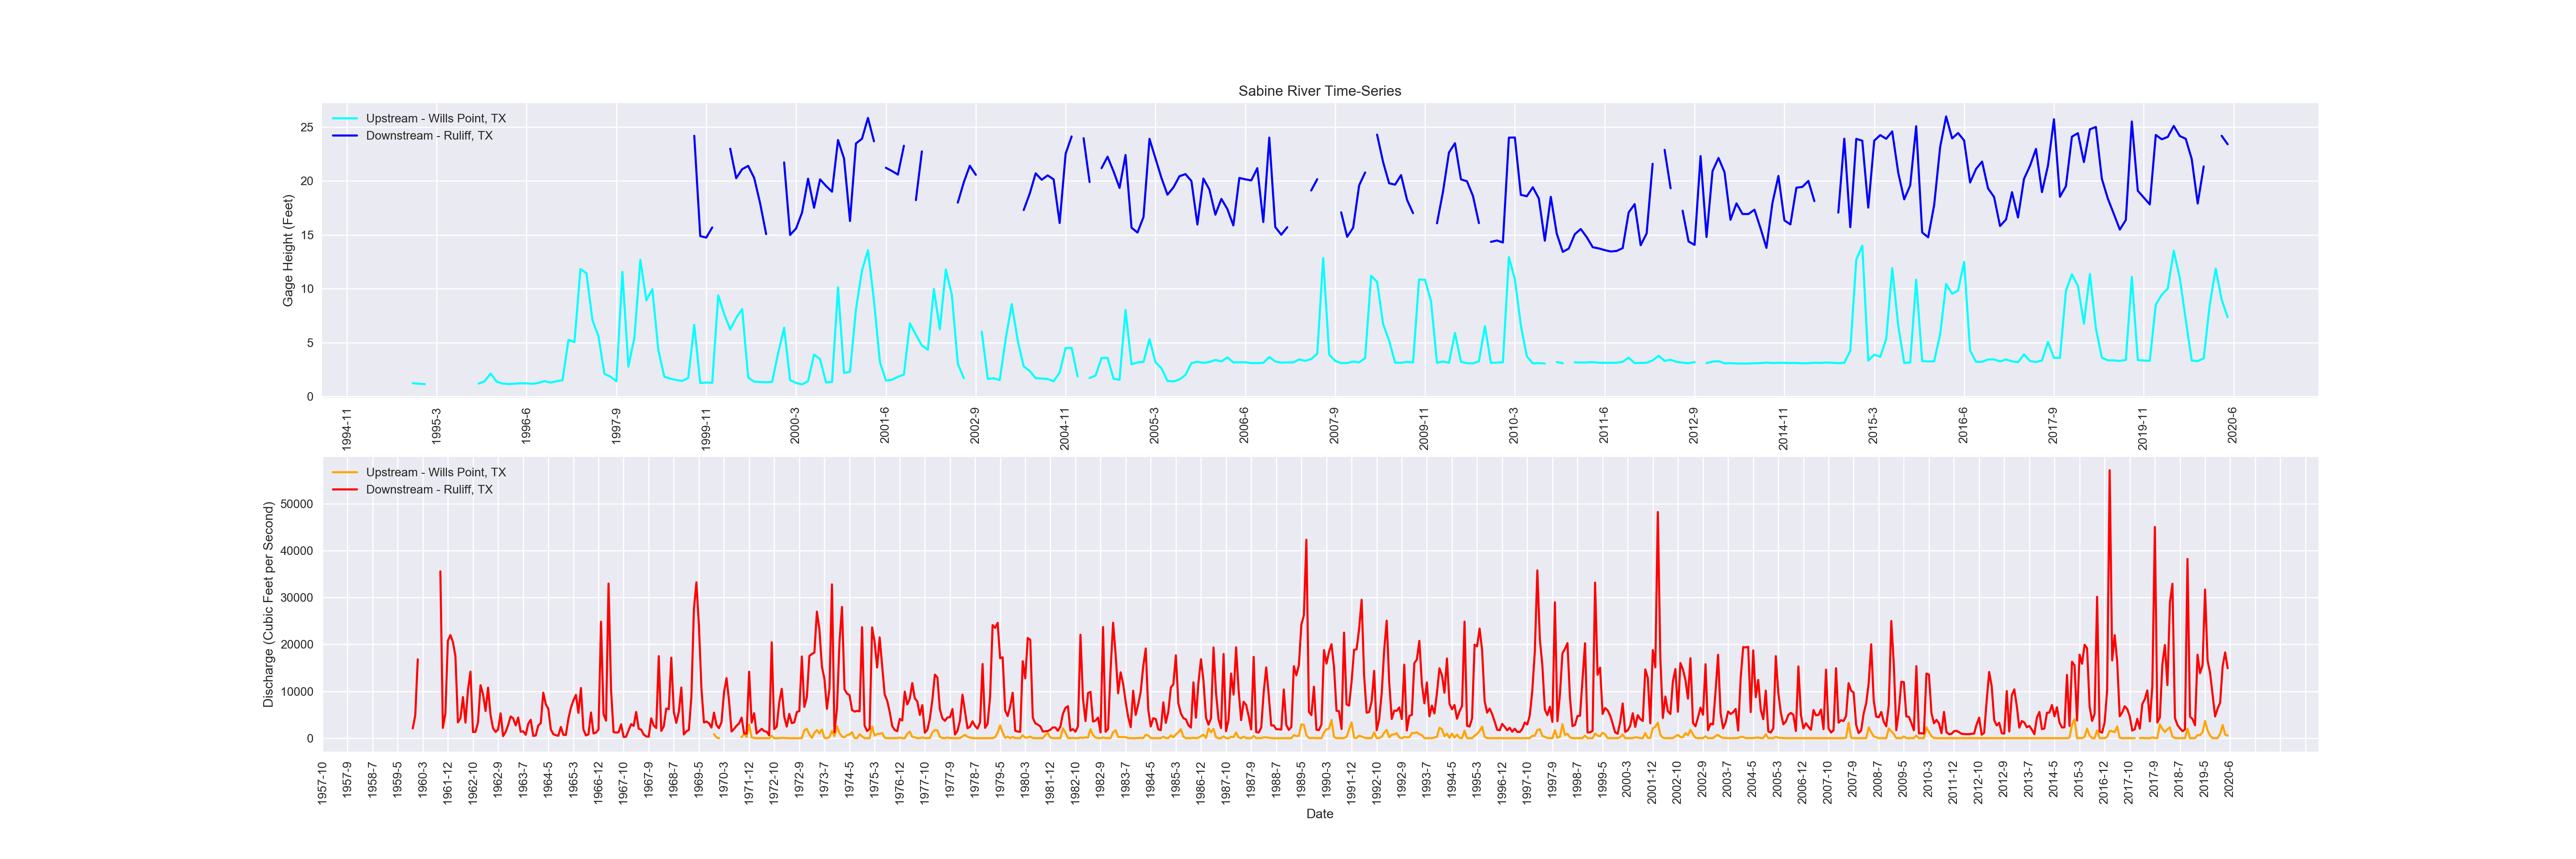
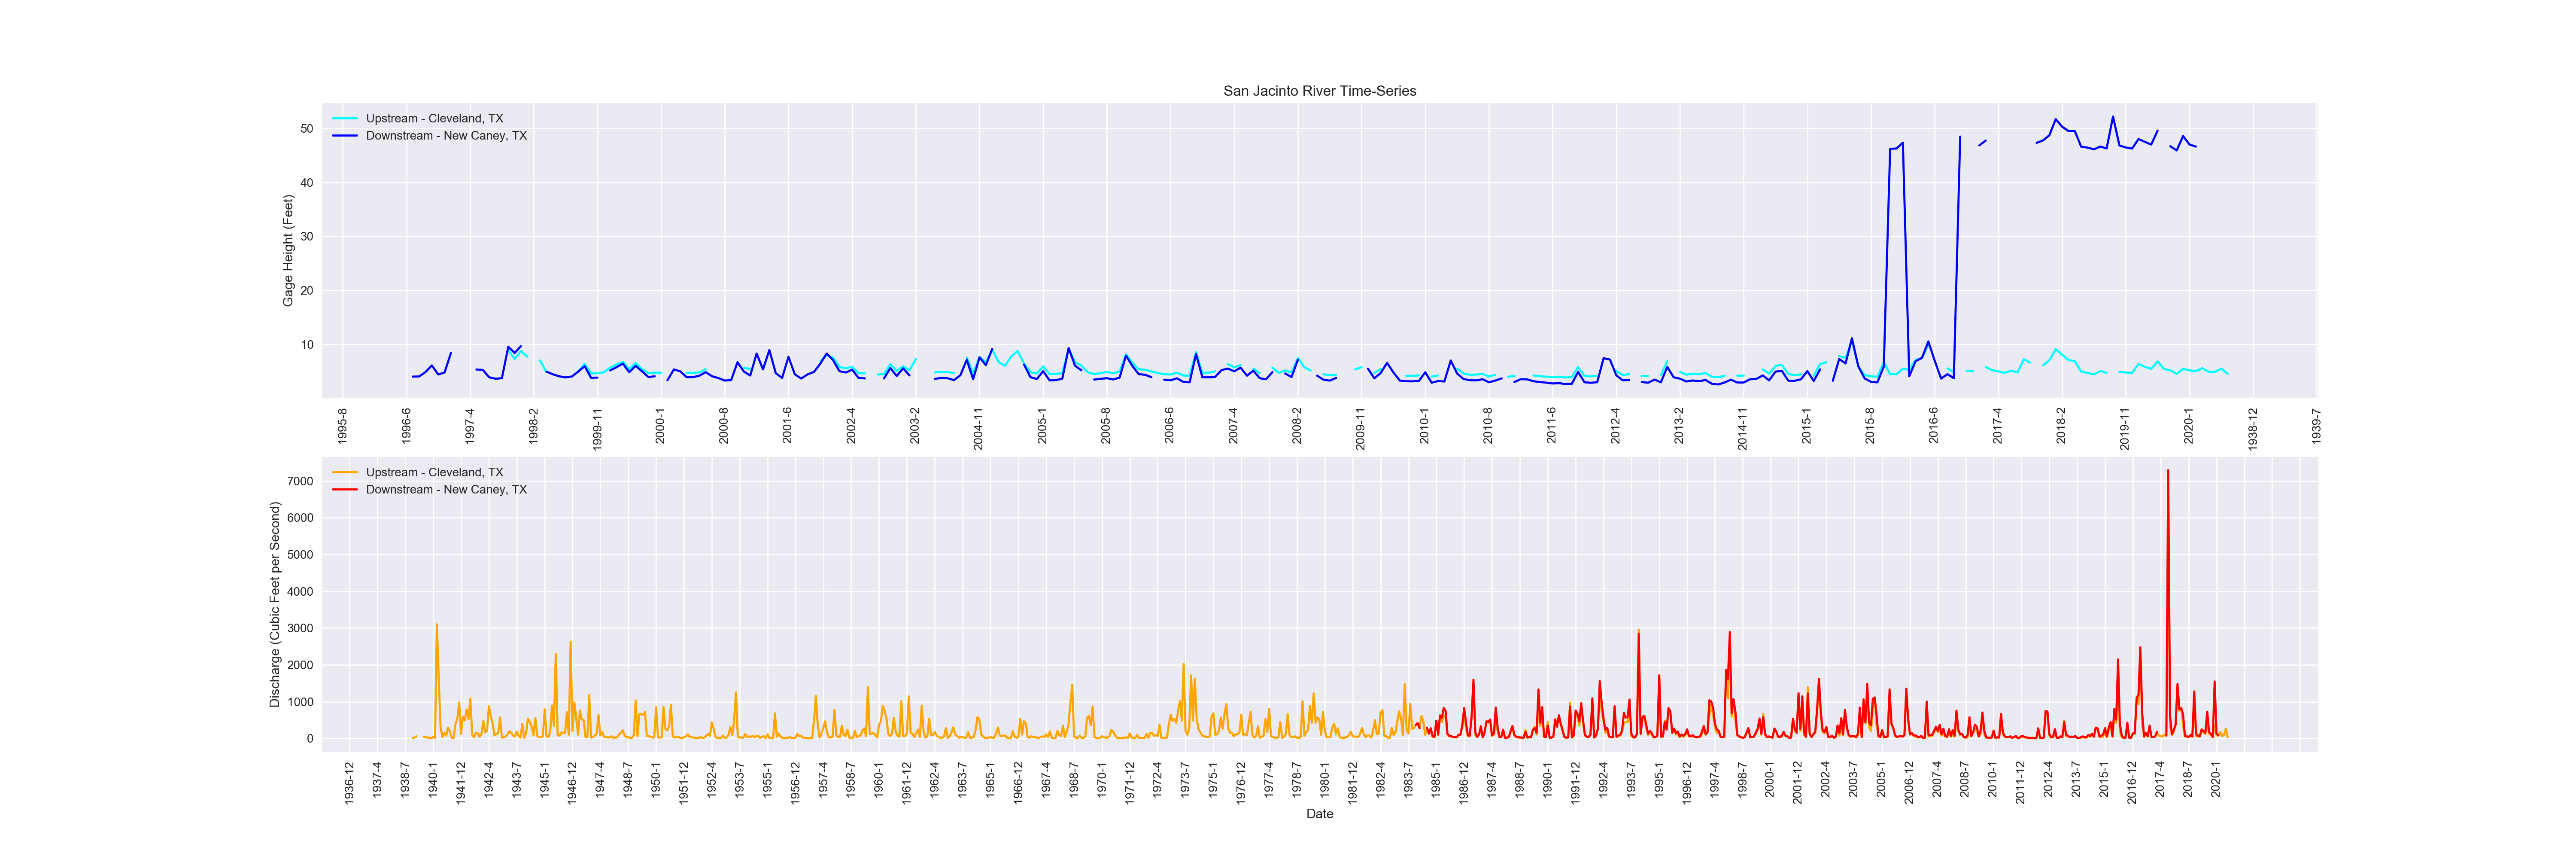
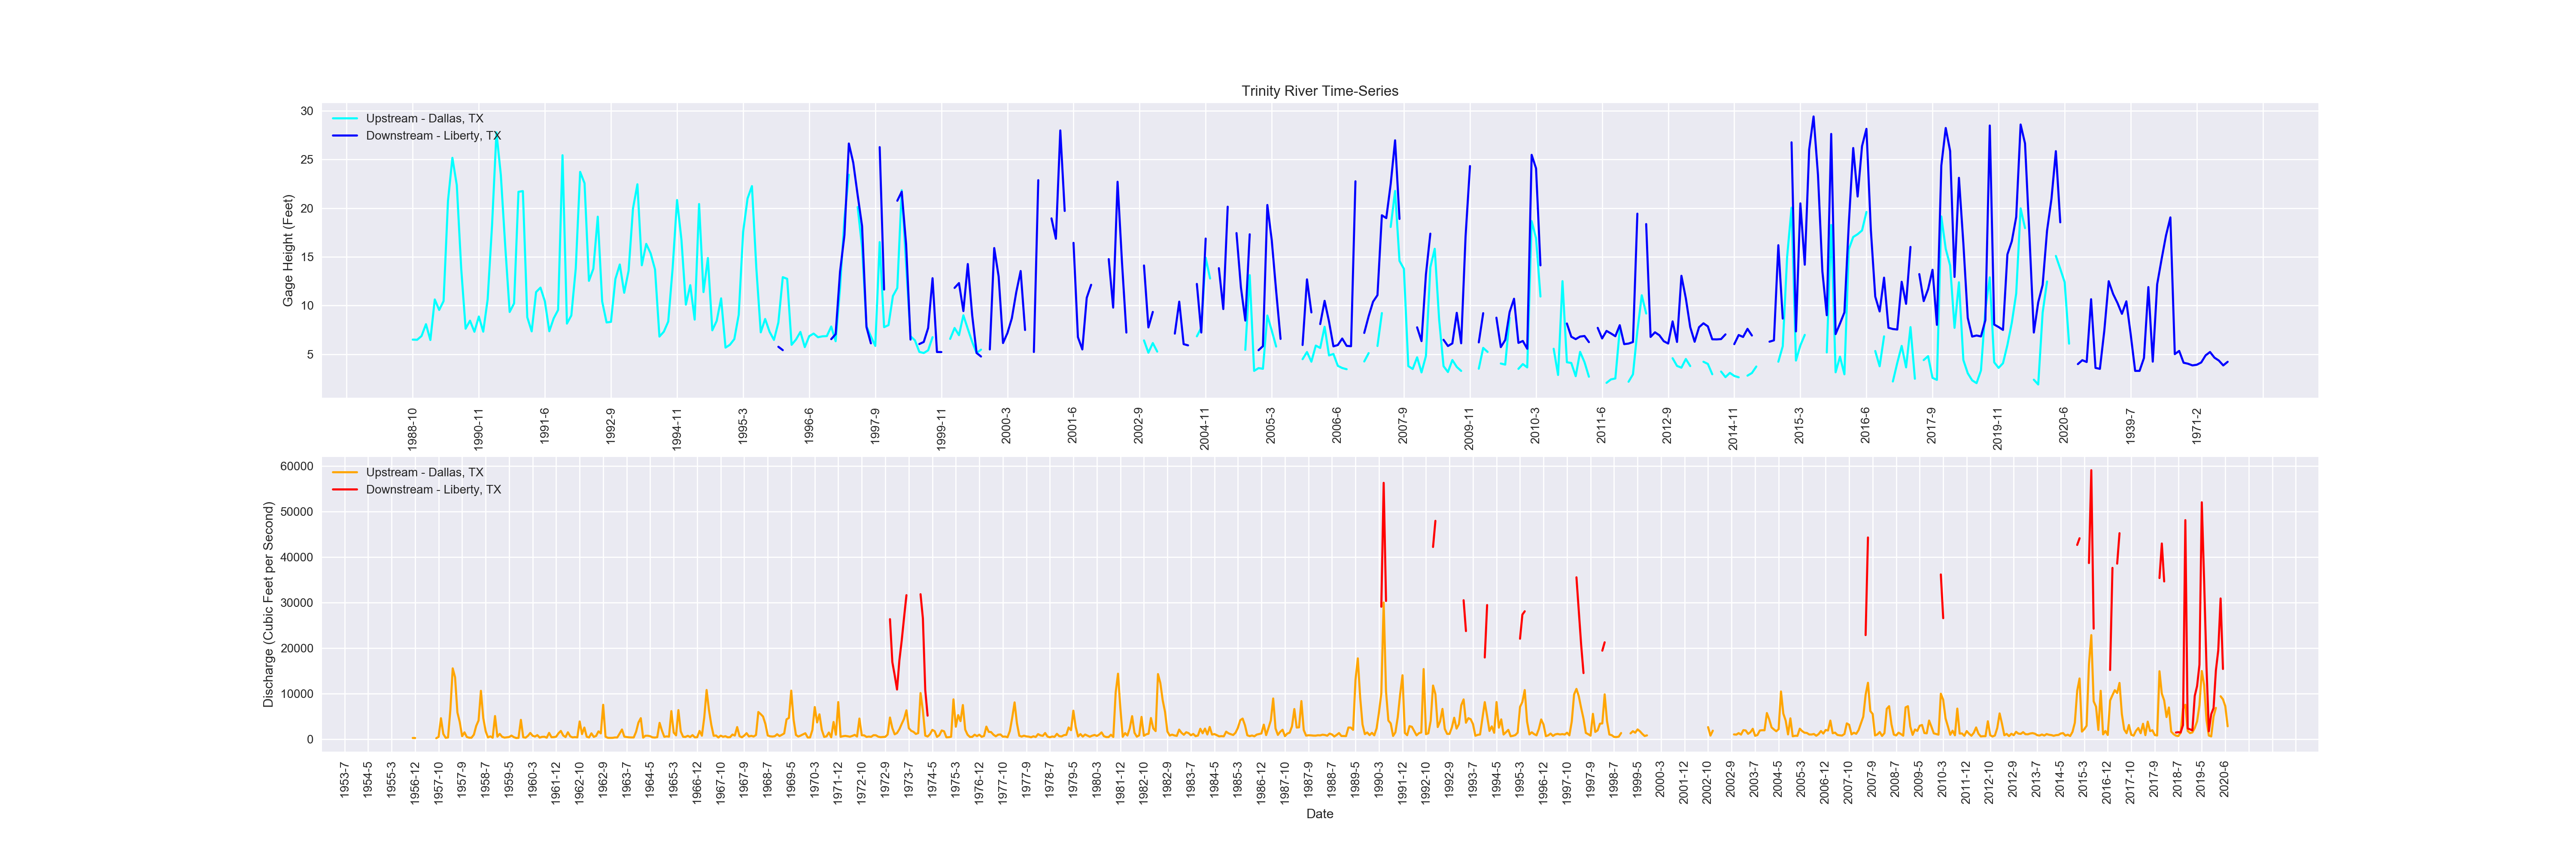
Although an exciting measure of climate stability and incredibly important for biodiversity and terrestrial growth, the river data collected was fractured across all sites. Two measures were used at two points of each river: gage height and discharge. Each of the rivers showed different trends at different points in time with different data consistency, so it is difficult to determine much definitively from the data. Even with these limitations, we can see that almost each river started to show periods of sharp spikes upward in gage height starting in 2015 and continuing to present day. This may suggest more sudden and heavy rainfall or flooding. From a purely visual perspective, there seems to be more variability in the most recent years, but this also may be due to the limitations of the data.
Individual River Charts